My best and worst stocks in 2013

My best and worst stocks in 2013

Here are my top 13 stocks in 2013

Netflix (NFLX) +312.14%
Tesla Motors (TSLA) +300.00% (bought in Jan 29)
3D Systems (DDD) +172.91%
Buffalo Wild Wings (BWLD) +104.60%
BIDU 89.03% (bought May 10)
Middleby (MIDD) +91.06%
Priceline (PCLN) +90.09%
Under Armour (UA) +84.09%
Chipotle Mexican Grill (CMG) +83.37%
Boston Beer Co (SAM) +81.81%
Sina (SINA) +74.23%
Amazon (AMZN) +62.40%
Ambarella (AMBA) +57.74% (bought Oct 25)

Yowzers – you can certainly see why my investment performance crushed the market this year. First off we have Netflix which is my most successful investment ever having originally bought in at $19.72 for a 1766% return 18 bagger for me. It’s been a volatile stock if you look at it in short term bursts and just two years ago it had fallen from $300 a share to $55, but if you look at the long term chart it’s been pretty rewarding for those investors that ignored the short-term noise. It also goes to show you that just because a stock is up 50%,100%,1000%+ from when you purchased it, it still may be the best spot for new money.

Next up Tesla Motors – I have only owned this stock since the end of January and I have bought it a number of times throughout the year. My first purchase is up 300% in less than 1 year of owning it.

3D systems returns to the list for the second straight year – last year it was my 2nd best stock – this year my 3rd. Hopefully it is back again next year and I get to take advantage of the compound interest.

I won’t go into each stock – but it was certainly an amazing year and one I will likely not see again. You’ll notice three of the stocks on the list I had purchased during the year and they still made the list. I feel very good about the stocks on this list, not because they went up so much this year, but because they are all great companies who are changing the world we live in and are very likely to be here 10 years from now. Despite the big run-up in many of these stocks and the crazy heights the overall stock market has reached – many of these stocks will be on my short list for future investment funds.

And now for the losers….ummmm……losers please step forward – there you two are….boooo…boooo!

Intuitive Surgical (ISRG) -8.40%
BJ’s Restaurant (BJRI) -6.25%

Only two of my stocks this year lost money. BJ’s is a repeat on the loser list from last year and ISRG is a stock I bought this July for the first time after a large fall in stock price due to concerns over the safety and effectiveness of their machines in certain types of surgeries. My current feelings are that robotic surgery is in its infancy and is likely to disrupt how many medical procedures are done in the future due to the precision and reduced recovery time. ISRG is clearly the market leader and I have missed the boat on the early part of this story even though I was well aware of this stock. I think this will be a temporary setback for the stock and am glad to get in on its future at a reduced price.

Regarding BJ’s again this is a small restaurant stock – very highly concentrated in California and is going through a learning process on how best to expand in the future. This will take some time and I am willing to wait and give them a chance to produce.

My Investment Holdings – January 2014

My Investment Holdings – January 2014

Well unlike other years there has been some change in my investment holdings not necessarily what I am invested in, but as I have grown more confident in my stock picking ability (scary thing) I have begun to weed out positions I have felt less confident in or only owned a small position in and have reduce the number of stocks I own from 40 stocks to 30 stocks and have become much more concentrated in the stocks I feel much more confident about.

Now I am still certainly a long-term buy and hold investor and of the 10 stocks I sold I owned just about every one of them 5+ years and well given my investment performance this year I think things are headed in the right direction.

I will admit to one completely boneheaded moron move. In my 401k you will notce I own VTINX which is the Vanguard Retirement Income Fund – which basically owns cash and bonds and safe investments. Going into 2013 I was feeling smart (scary thing) and you know the market has been on a crazy run since 2009, so I knew the top was coming so I moved $20,000 of my 401k money into this basically cash fund as a hedge that I could then move into an all stock index fund when the market inevitably had its pullback. Yeah the market had one of its best years ever returning nearly 30% and I had $20k sitting in cash as a young person investing for a retirement 20+ years down the road. I’ve said it before – you are an idiot if you think you can time the market and there is a 100% chance you will hurt your investment returns. Unfortunately I didn’t listen to myself. In the grand scheme of things it probably only cost me $2-3k, but I am a moron and learned another lesson.

1VTTSX25.79%
2VIEIX10.68%
3BWLD6.03%
4VPMAX5.53%
5VTINX5.30%
6NFLX4.53%
7AMZN4.47%
8PNRA4.34%
9CMG3.93%
10UA3.27%
11DDD2.94%
12TSLA2.67%
13AAPL2.45%
14SBUX2.27%
15WFM2.21%
16BJRI1.74%
17MIDD1.70%
18SSYS1.36%
19BIP1.34%
20FOSL0.98%
21IPGP0.81%
22BIDU0.58%
23AMBA0.54%
24SINA0.51%
25SCTY0.47%
26BOFI0.43%
27ISRG0.42%
28TXRH0.40%
29SAM0.40%
30GWR0.39%
31COST0.36%
32EXEL0.35%
33PCLN0.32%
34MELI0.29%
35CASH$$0.21%
Retirement Nestegg Report – December 2013

Retirement Nestegg Report – December 2013

Wow another year has already passed and this sure was one of the most exciting years for my retirement nestegg growth. My retirement nestegg grew 62% in 2013 or $140,370.78!! If you take out my contributions for the year my investments made me $113,682.25 this year!

That is absolutely insane as my portfolio which just sits there and takes extremely little work on my behalf is now making more than my salary in my 40 hour a week day job. It also more than the $100,000 goal I had set for myself to save by age 30 in just one year with no contributions on my part! Compound interest is an amazing force!

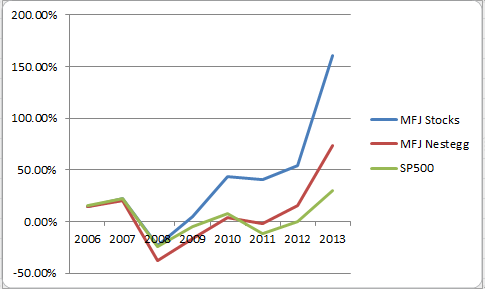
On top of that my investment performance was outstanding this year and my individual stock portfolio returned over 68% this year besting the SP 500 by almost 39% on top of the fact that the stock market had one its best years ever.

Taxable Account – $2,840.14 (-0.11%)
Traditional Rollover IRA – $28,983.28 (+5.10%)
My Roth IRA – $105,925.74 (+3.64%)
Wife Roth IRA – $55,934.43 (+3.11%)
Traditional 401k – $173,158.95 (+2.42%)

Roth/Traditional % = 44.12% (tax free)

Total Retirement Nest Egg $366,842.54 (+3.06% 1 month) (+62.00% 1 year)

Monthly Contributions $736.74 (401k)
SPY Performance +2.36%
My Monthly Investment Performance +2.86% (+0.50% vs SP500)
My Monthly Individual Stocks Performance +3.65% (+1.29% vs SP500)

My contributions for 2013 $26,688.53 ($17,788.53 401k) ($8000 Wife Roth IRA) ($900 Taxable Account)
SP500 Performance for 2013 +29.60%
Investment Performance for 2013 +50.20% (+20.60% vs SP500)
Individual Stock Performance for 2013 +68.58% (+38.98% vs SP500)
Total Investment Return 2013 +$113,682.25

2013 Retirement Nestegg Growth

Retirement Nestegg Report – November 2013

Retirement Nestegg Report – November 2013

As usual another new high and another significant out performance by my investments of the SP500 index. This really cannot go on forever as I’ve had many years worth of gains just this year alone. Let’s hope for another financial apocalypse sometime soon. In related news I have finally I believe secured a piece of land to build our house on. After many years of searching we have a signed purchase agreement for 15 acres of land and will likely be building next year. Poor financial decision, but not everything is about dollars and cents and hopefully with this out of the way in 2014 I can concentrate more on our finances going forward. Meanwhile this cruise control thing has worked out pretty good for us.

Taxable Account – $ 2,843.34 (+11.91%)
Traditional Rollover IRA – $27,577.98 (+4.43%)
My Roth IRA – $ 102,201.93 (+5.03%)
Wife Roth IRA – $54,249.70 (+3.89%)
Traditional 401k – $169,066.71 (+2.48%)

Roth/Traditional % = 43.57% (tax free)

Total Retirement Nest Egg $355,939.66 (+3.64%)

Monthly Contributions $736.74 (401k) $1500 (Wife Roth IRA)
SPY Performance +2.81%
My Monthly Investment Performance +2.98% (+0.17%)
My Monthly Individual Stocks Performance +3.86% (+1.05%)

Retirement Nestegg Report – October 2013

Retirement Nestegg Report – October 2013

Well I sound like a broken record – another great month for my retirement nestegg report and another great month for investment outperformance of the SP500. Seriously this cannot go on forever and I actually at this point would much more prefer the stock market head south, but have to admit its fun watching my retirement nestegg grow by $2k just about every day.

Taxable Account – $2,540.76 (+0.16%)
Traditional Rollover IRA – $26,409.36 (+13.63%)
My Roth IRA – $97,307.85 (+8.89%)
Wife Roth IRA – $52,222.36 (+2.62%)
Traditional 401k – $164,972.78 (+3.66%)

Roth/Traditional % = 43.57% (tax free)

Total Retirement Nest Egg $343,453.11 (+5.62%)

Monthly Contributions $736.74 (401k)
SPY Performance +4.46%
My Monthly Investment Performance +5.39% (+0.93%)
My Monthly Individual Stocks Performance +7.50% (+3.04%)

Retirement Nestegg Report – September 2013

Retirement Nestegg Report – September 2013

Well another great month of retirement nestegg growth and another great month of market outperformance by my investments. My nestegg had over $16,000 just in investment gains this month which I think is the second highest ever for me (July 2013) and my nestegg has grown $105,000 or 47.6% since my report last Septemeber

What does all of this mean? It means I am a financial genius – or it could be that the stock market has gone bonkers the last 3-4 years and I’ve ridden a few lucky stock investments to unforeseen highs and it could all come crashing down by next month 🙂 Bottom line month to month or year to year performance doesn’t really tell you too much but given the trend of the last few years I think I am headed in the right direction.

Taxable Account – $2,536.48 (-4.41%)
Traditional Rollover IRA – $23,241.99 (+7.45%)
My Roth IRA – $89,359.75 (+6.13%)
Wife Roth IRA – $50,890.69 (+4.85%)
Traditional 401k – $159,147.00 (+5.14%)

Roth/Traditional % = 42.72% (tax free)

Total Retirement Nest Egg $325,175.91 (+5.44%)

Monthly Contributions $736.74 (401k)
SPY Performance +2.98%
My Monthly Investment Performance +5.20% (+2.22%)
My Monthly Individual Stocks Performance +5.74% (+2.76%)

Retirement Nestegg Report – August 2013

Retirement Nestegg Report – August 2013

Well another nice little bump in my retirement nestegg this month and what has to be my best investment performance ever versus the SP 500. I outperformed the market by over 4% this month and my individual stocks outperformed by nearly 7%. This performance was driven largely by the performance of Netflix, Tesla Motors, and 3D systems all of whom were up significantly this month and are stocks that have grown to be major players in my stock portfolio.

As I look back on my individual stock performance it is pretty impressive – I have beaten the market pretty significantly 8 of the last 9 months and in general since I started tracking my nestegg and individual stock performance almost 8 years ago. At least for ME I feel that stocks deserve to be a portion of my investment vehicles and over time I think I have learned a thing or two, starting out though I definitely learned some costly mistakes that I hope not to repeat.

Anyway here is this month’s report.

Taxable Account – $2,653.58 (-1.29%)
Traditional Rollover IRA – $21,629.93 (+2.94%)
My Roth IRA – $84,198.14 (+2.94%)
Wife Roth IRA – $48,538.80 (+5.91%)
Traditional 401k – $151,369.53 (-1.48%)

Roth/Traditional % = 42.72% (tax free)

Total Retirement Nest Egg $308,389.98 (+1.89%)

Monthly Contributions $736.74 (401k)
SPY Performance -3.13%
My Monthly Investment Performance +0.89% (+4.02%)
My Monthly Individual Stocks Performance +3.75% (+6.88%)