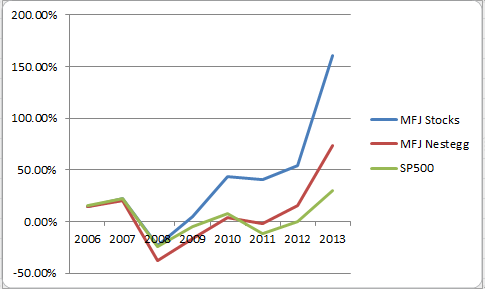
My all-time investment performance January 2014
I figured this is something I should be doing now that I have enough history to take a look at my investment performance over the long term versus the market. Since I have made the decision to invest solely in stocks in my IRAs I need to take a look to see if that decision is paying off or worth the trouble. I do track this with each monthly report as well as each yearly recap – but I have never taken the time to look at my investment performance since the beginning of time.
Now granted this year is very much in my favor so don’t anoint me as the next Peter Lynch just yet, but I have to say I was very pleasantly surprised to see how well I am doing when you stack it all together.
Since I started tracking my values on this blog in 2005 my investment performance for all of my investment vehicles (401k, Roth & Traditional IRAs) has resulted in a total investment return of 74.01% over the last 8 years for an annualized return of 7.17%. Meanwhile the SP500 over that same period of time has returned 29.81% or 3.32% annualized return. So my performance has been over double that of the SP 500.
Now since the vast amount of my 401k is an Vanguard Index Lifestyle fund that is closely tracking the SP 500 you will wonder how I outperformed the market so well. Well about half of my retirement nestegg is in my and my wife’s Roth IRAs which are invested 100% in individual stocks trying to beat the market. Over the same 8 year period of time my individual stocks have returned 160.55% total investment return or just under 12.72% annualized returns or over quadruple the returns of the SP 500.
Cummulative Returns By Year

| Year | MFJ Stocks | MFJ Nestegg | SP500 |
|---|---|---|---|
| 2006 | 14.20% | 14.37% | 15.79% |
| 2007 | 22.48% | 20.66% | 22.15% |
| 2008 | -22.84% | -37.23% | -24.56% |
| 2009 | 4.77% | -16.68% | -4.60% |
| 2010 | 43.47% | 3.82% | 7.65% |
| 2011 | 40.19% | -1.92% | -11.73% |
| 2012 | 54.56% | 15.85% | 0.16% |
| 2013 | 160.55% | 74.01% | 29.81% |