Browsed by
Month: January 2016

The Long Term View of My NestEgg

The Long Term View of My NestEgg

When I started this blog in 2005 I wasn’t exactly sure why I was doing it. I knew it was for me to learn about myself, but I think one of the big things I remember thinking at the time was it would be a vehicle for me to be able to look back in time and see how the day to day, month to month, and year to year gyrations of the stock market mean nothing in the grand scheme of things and how the people who promote the gyrations and the people who listen to and react to those short term gyrations are foolish.

Well 10+ years of blogging and tracking my accounts have left me with a picture that I think the 26 year old MFJ thought he would see down the road.

NestEggGrowth

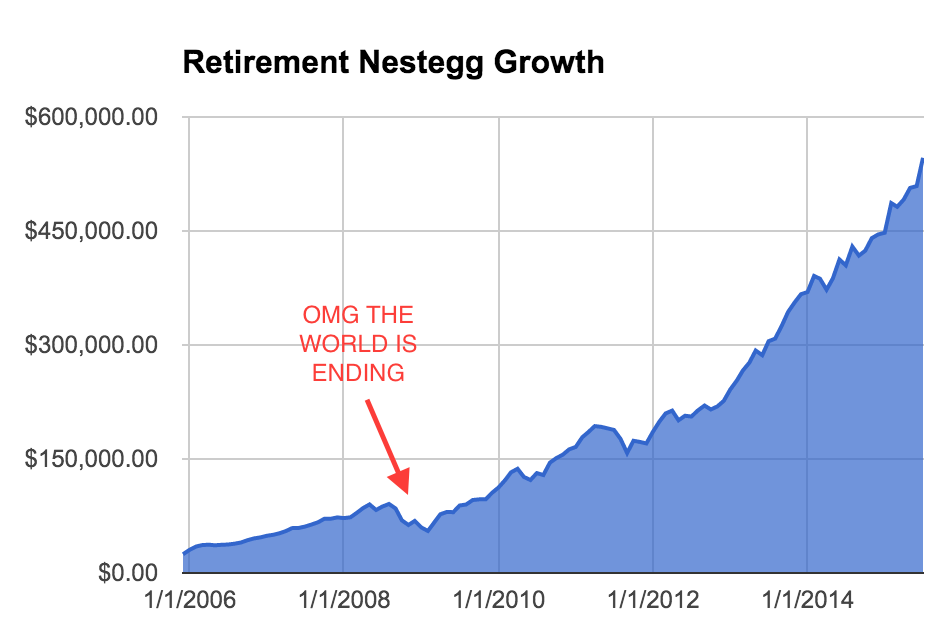
It kind of blows my mind looking at that chart – especially the trajectory. That whole compounding thing is pretty powerful. The other thing that kind of blows my mind is that you have to almost squint to see the “Great Recession” where the economy and stock market imploded and if you listened to any of the news media the world was going to come to an end. Even some of the best Personal Finance bloggers out there at the time were losing their minds.

But just look at that picture – if you did anything other than plow your money into the market your entire lifetime you were throwing away boatloads of money.

Now granted I have slightly outperformed the market over the years, but here is a stat for you that I’m sure most people would argue can’t be true.

The SP500 during this tumultuous decade of lost wealth, stagnating economy, and just general doom has been up 12 of the last 13 years.

That’s right since 2003 the SP500 has only been down 1 time. That’s 92%!! The last decade plus has been an absolutely incredible time to invest in the stock market, but again I bet 92% of people you asked would have told you the stock market has lost money almost every year.

Even the last 13 years aren’t even that remarkable. Since I have been alive the SP500 has only been down 6 times. So 30 out of 36 years I’ve been alive – the SP500 has had positive returns.

The odds are definitely in your favor so if you haven’t already – get started, start investing, and create your own amazing chart of wealth awesomeness. All it takes is saving money, investing money, and time – then wait for the amazing things to happen.

Best and Worst Stocks in 2015

Best and Worst Stocks in 2015

Here are my top stock performers for 2015

Netflix +135.45%
Amazon +118.67%
Starbucks +46.70%
Arista Networks +19.30%
IPG Photonics +18.39%
Under Armour +18.39%
Costco +12.58%
Panera +12.42%

Obviously Netflix and Amazon knocked it out of the park this year. It goes to show you that the same stocks can carry your portfolio over time. Netflix and Amazon are some of my biggest winners historically and yet here they are leading the charge again this year. Though Netflix and Amazon were top losers for me last year and I wrote this in last years report about Amazon – looks like Jeff was listening

Amazon – Jeff Bezos will take over the world – end of story. The stock market only concerns themselves with short-term results which he cares nothing about. Keep going Jeff!

Under Armour is a repeat top performer from last year and I think the future is extremely bright for all of the stocks on this list and I expect to see them on future top stock lists.

And now for the losers…

3D Systems -73.63%
Stratasys -72.11%
InvenSense -37.15%
Sam Adams -31.73%
Whole Foods Market -30.78%
Chipotle -29.23%
Bidu -19.51%

Ouch 3D printers 🙂 Two years in a row of just getting pummeled for anything 3D printer related. They were wall street darlings a few years ago and now wall street hates them – we’ll see long term if the industry and these companies are viable businesses.

Sam Adams, Whole Foods, and Chipotle – not a great year for food stocks and lots of questions around competition in these areas. These are all top notch companies run by visionaries in their field and my money is on them winning in the long term just like they have historically. They may go through some growing pains, but long term they have better talent and better strategies.

Bidu – Anything Chinese will be volatile as is their entire economy. Bidu is a tech titan and should be a major player in a major market.

My All Time Investment Performance January 2016

My All Time Investment Performance January 2016

Continuing on my tradition from last year I have calculated my cumulative investment returns from 2006 until now against the SP500. I actually had to make some corrections to my calculation as I had missed the SP500 dividends in the annual return for some years so my outperformance was not quite as big as I had previously stated.

Overall my nestegg returns are still besting the SP500 though not quite as handedly as before. One item of note is my individual stock investments have crushed the SP500 over the years but my overall nestegg has just barely edged it out. This basically means I’ve underperformed the index with my 401k investments – which is kind of disappointing.

75% of my 401k today is in index/lifestyle funds, but in the past I’ve probably tried to be too smart and like most people cost myself returns versus just doing the smart/easy thing and sticking it all in an index fund. This is something for me to keep on an eye on.

On the other hand my stock performance has been so good it probably makes sense for me to just quit my job so I can cash out the quarter million dollars I have tied up in my 401k.

Returns By Year

YearSP500MFJ NesteggMFJ Stocks
200615.79%14.37%14.20%
20075.49%5.50%7.25%
2008-38.42%-47.98%-37.00%
200926.46%32.75%35.78%
201012.48%24.60%36.94%
20110.31%-5.53%-2.29%
201213.47%18.12%10.25%
201329.60%50.20%68.58%
201411.39%8.91%7.91%
2015-0.73%7.3414.34

Cumulative Returns By Year

YearSP500MFJ NesteggMFJ Stocks
200615.79%14.37%14.20%
200722.15%20.66%22.48%
2008-24.78%-37.23%-22.84%
2009-4.88%-16.68%4.77%
20106.99%3.82%43.47%
20117.32%-1.92%40.19%
201221.78%15.85%54.56%
201357.83%74.01%160.55%
201475.80%89.51%181.16%
201574.52%103.42%221.48%

Annualized Returns since 2006

SP500 +7.30%
MFJ Nestegg +7.36%
MFJ Stocks +12.39%

My Investment Holdings – January 2016

My Investment Holdings – January 2016

In annual tradition I will list all of my current investments. These really do not change significantly from year to year as I don’t do a lot of buying and selling and well now as my portfolio has grown so big the amount of money I am putting in towards new investments tends to be sort of insignificant.

Looking back to last year’s list it really is pretty similar with my 401k mutual funds taking up about the same percentage. My stop stock holdings have shifted slightly due to appreciation/depreciation with my top 5 holdings being Netflix, Under Armour, Tesla, Amazon, and Buffalo Wild Wings of which Amazon and Tesla have replaced Chipotle and Panera.

SYMBOLPercentage
VIEIX11.20%
VINIX11.60%
VILVX11.17%
VPMAX11.83%
NFLX7.36%
UA5.83%
TSLA5.75%
AMZN5.31%
BWLD4.77%
SCTY3.46%
SBUX2.54%
AAPL2.50%
CMG2.48%
MIDD1.96%
AMBA1.55%
BJRI1.33%
WFM1.10%
BOFI1.10%
PNRA1.08%
BIP1.04%
IPGP0.65%
ANET0.63%
TXRH0.56%
ZOES0.51%
BIDU0.43%
PRLB0.43%
ISRG0.42%
COST0.36%
PCLN0.24%
SAM0.23%
DDD0.21%
INVN0.20%
SSYS0.17%
Retirement Nestegg Report – December 2015

Retirement Nestegg Report – December 2015

Well another year in the books and another year of growth for my nestegg. Overall my nestegg grew by over $80,000 this year and topped the half-million mark in April.

My investments outperformed the SP500 pretty handedly this year with my nestegg investments besting the SP500 by almost 6% and my individual stock accounts besting it by almost 13% which is excellent – especially in a flat year like 2015. **note earlier version of this post incorrectly listed SP500 return without dividends

Another very positive thing is that I contributed $47,500 to my nestegg this year which is an all-time record for me as well. This is actually a little surprising for me given all of the expenses we had this year with a new baby and being in the middle of building our dream home. I definitely have $50,000 in my sites for next year – which is also what I said last year, but I still have the looming house hanging over my head so am still hanging onto a large cash cushion for surprises.

Taxable Account – $23,691.87 (+11.88%)
Traditional Rollover IRA – $31,829.74 (-3.07%)
My Roth IRA – $146,721.47 (-2.28%)
Wife Roth IRA – $82,105.95 (-0.12%)
Traditional 401k – $241,310.02 (-0.76%)

Roth/Traditional % = 43.53% (tax free)

Total Retirement Nest Egg $525,659.05 (-0.73%)
Retirement Salary (4%) – $21,026.36

Monthly Contributions $802.85 (401k)
SP500 Performance -1.75%
My Monthly Investment Performance -0.88% (+0.87% vs SP500)
My Monthly Individual Stocks Performance -0.70% (+1.05% vs SP500)

My retirement contributions for 2015 $47,506.55
401k $18,000.00
401k matching $11,206.55
My Roth IRA $5,500
Wife Roth IRA $5,500
Taxable Account $7,300

SP500 Performance for 2015 +1.38%
Investment Performance for 2015 +7.34% (+5.96% vs SP500)
Individual Stock Performance for 2015 +14.34% (+12.96% vs SP500)
Total Investment Return 2015 +$32,684.06

2015NestEggGrowth

2015ContributionsByYear