My All-Time Investment Performance January 2015
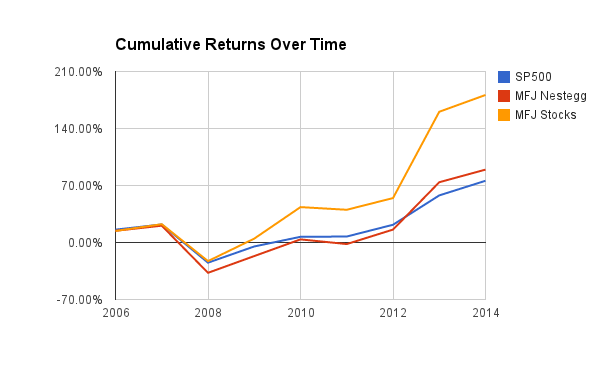
Continuing on my tradition from last year I have calculated my cumulative investment returns from 2006 until now against the SP500. The good news is that I am still pretty handily beating the SP500, especially when it comes to my individual stock investments, but the bad news is that I trailed the market by a few percentage points this year. Given my massive outperformance last year I can’t be too upset about trailing by a few points.
During the 9 years I have been tracking my investments closely enough to calculate returns the SP500 has produced annualized returns of 6.47%. During the same period of time all of the investments in my Retirement Nestegg have produced 7.36% annualized returns which is nice to be beating the market. But where I am really proud of is that my individual stock picks which now make up more than half of my portfolio have returned annualized returns of 12.17% which is nearly double what the SP500 has returned. If I am able to keep this up financial independence is not too far around the corner
Cummulative Returns By Year

| Year | SP500 | MFJ Nestegg | MFJ Stocks |
|---|---|---|---|
| 2006 | 15.79% | 14.37% | 14.20% |
| 2007 | 22.15% | 20.66% | 22.48% |
| 2008 | -24.78% | -37.23% | -22.84% |
| 2009 | -4.88% | -16.68% | 4.77% |
| 2010 | 6.99% | 3.82% | 43.47% |
| 2011 | 7.32% | -1.92% | 40.19% |
| 2012 | 21.78% | 15.85% | 54.56% |
| 2013 | 57.83% | 74.01% | 160.55% |
| 2014 | 75.80% | 89.51% | 181.16% |
Yearly Returns By Year
| Year | SP500 | MFJ Nestegg | MFJ Stocks |
|---|---|---|---|
| 2006 | 15.79% | 14.37% | 14.20% |
| 2007 | 5.49% | 5.50% | 7.25% |
| 2008 | -38.42% | -47.98% | -37.00% |
| 2009 | 26.46% | 32.75% | 35.78% |
| 2010 | 12.48% | 24.60% | 36.94% |
| 2011 | 0.31% | -5.53% | -2.29% |
| 2012 | 13.47% | 18.12% | 10.25% |
| 2013 | 29.60% | 50.20% | 68.58% |
| 2014 | 11.39% | 8.91% | 7.91% |