Browsed by
Month: January 2020

Interim Retirement Nestegg Report $1.3M

Interim Retirement Nestegg Report $1.3M

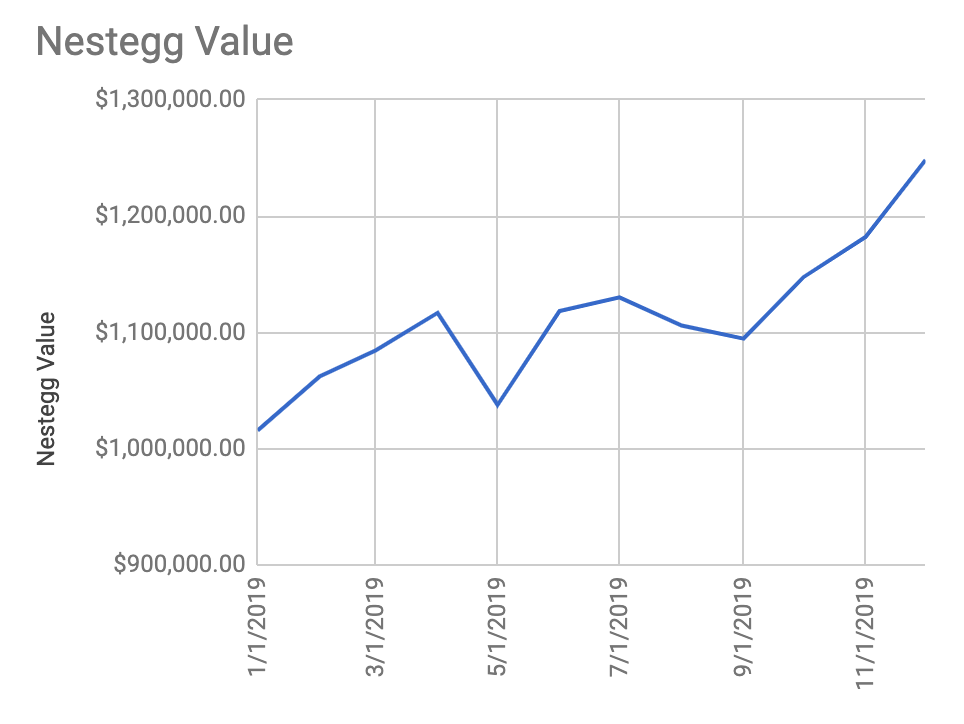
Well it wasn’t in the same month, but we’ve actually hit our next $100k milestone in less than a month since we hit the last one. On Dec 16th we hit $1.2M for the first time and now just 28 days later we have hit $1.3M.

What’s even more impressive is the market is up about 2% during that time but our nestegg grew over 8% due to some very strong gains by some of our individual stocks such as Tesla, Shop, NFLX, and Amazon.

Obviously this can’t go on forever in the short term but over the long term this type of thing can come to be expected. I mean just last month I predicted that I’d eventually write 2 of these reports in the same month and well here we are and each successive $100k is going to take less and less work to achieve due to the magic of compounding.

I spent over 30 years of my life trying to accumulate the first $100k and now 10 years later I was able to accumulate that much in just 28 days. Pretty amazing and can’t wait to see what other insane milestone is up next.

Taxable Account- $76,452.07
Private Stock $72,000
Traditional Rollover IRA – $48,108.15
My Roth IRA – $330,143.06
Wife Roth IRA – $208,360.42
Wife 401k – $4,810.64
Traditional 401k – $560,668.48

Roth/Traditional % = 41.41% (tax free)

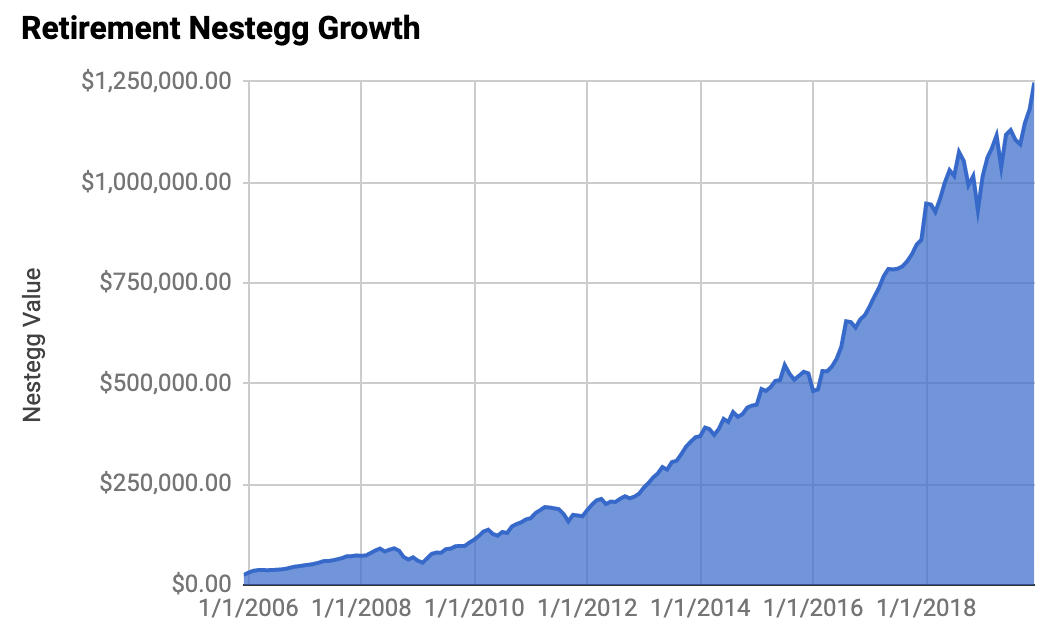
Total Retirement Nest Egg $1,300,542.82
Retirement Salary (4%) $52,021

$100,000 NestEgg Milestones

Date DOW Jones Value MFJ Nestegg Time to Achieve
Oct 2008 10,000 $ 69,300 29 years 2 months
Oct 2009 10,000 (+0%) $100,000 (+44%) 30 years 2 months
Feb 2012 13,000 (+30%) $200,000 (+100%) 2 years 5 months
Jul 2013 15,423 (+19%) $300,000 (+50%) 1 years 5 months
Feb 2014 16,395.88 (+6.3%) $400,000 (+33%) 7 months
April 2015 18,084.48 (+10.30%) $500,000 (+25%) 1 year 2 months
August 2016 18,636.05 (+3.05%) $600,000 (+20%) 1 year 4 months
January 2017 20,068.51 (+7.69%) $700,000 (+17%) 5 months
June 2017 $21,182.53 (+5.56%) $800,000 (+14%) 5 months
January 2018 $25,484.72(+20.31%) $900,000 (+12.5%) 7 months
May 2018 $24,667.78(-3.21%) $1,000,000 (+11.1%) 4 months
April 2019 $26,234.34 (+2.94%) $1,100,000 (+10.0%) 11 months
December 2019 $28,331.20 (+7.99%) $1,200,000 (+9.1%) 8 months
January 2020 $28,885.42(+1.96%) $1,300,000 (+8.3%) 0 months 28 days
My All Time Investment Performance January 2020

My All Time Investment Performance January 2020

Well I have been investing for 14 full years now and must say I’m very happy with the performance of my individual stocks. I think most of this has been luck as I’ve owned some of the best stocks of the last 20 years (Netflix, Amazon, etc), but also think I can take a tiny bit of credit of having some foresight on those companies and not buying into the noise in the financial news.

I’ve actually only invested $149k in individual stocks and yet they were worth over $688k. On the flip side I’ve invested over $302k in index funds and they are worth $554k. Had I not toyed around and gotten “lucky” with my individual stocks my life plans would be a little different right now.

MFJ Returns By Year

YearSP500MFJ NesteggMFJ Stocks
200615.79%14.37%14.20%
20075.49%5.50%7.25%
2008-37.00%-47.98%-37.00%
200926.46%32.75%35.78%
201015.06%24.60%36.94%
20112.11%-5.53%-2.29%
201216.00%18.12%10.25%
201332.39%50.20%68.58%
201413.69%8.91%7.91%
20151.38%7.34%14.34%
20169.54%3.32%-4.57%
201718.42%23.31%27.49%
2018-6.24%4.56%15.60%
201928.72%32.46%37.07%

MFJ Cumulative Returns By Year

YearSP500MFJ NesteggMFJ Stocks
200615.79%14.37%14.20%
200722.15%20.66%22.48%
2008-23.05%-37.23%-22.84%
2009-2.69%-16.68%4.77%
201011.97%3.82%43.47%
201114.33%-1.92%40.19%
201232.63%15.85%54.56%
201375.58%74.01%160.55%
201499.62%89.51%181.16%
2015102.37%103.42%221.48%
2016121.68%110.18%206.79%
2017162.52%159.17%291.12%
2018146.13%170.99%352.14%
2019216.82%258.95%519.75%

Annualized Returns since 2006

SP500 +8.59%
MFJ Nestegg +9.56%
MFJ Stocks +13.92%

My best and worst stocks in 2019

My best and worst stocks in 2019

I actually only had 10 stocks beat the market this year and 12 stocks that trailed the market, yet my overall individual stock performance almost bested the market by over 10% points for 2019

Shopify led the way with a banner year almost tripling in value in 2019 and has now grown to become my 3rd largest individual holding.

Chipotle made the list for a 2nd year in a row and is completing its massive comeback after being on my biggest loser list in 2015,2016, and 2017.

Apple was actually a surprise for me being the largest company in the world but still growing at a small cap rate.

Actually with the exception of Shopify and Alteryx I would have looked at the rest of the stocks on the list as boring stable companies and here they are outpacing many of the supposed high flyer stocks in a banner year for the market.

Shopify +187.17%
Chipotle Mexican Grill +93.87%
Apple +86.16%
Alteryx +68.27%
Brookfield Infrastructure Partners +44.77%
Costco +44.28%

As far as biggest losers there really is only one. BJ’s was down nearly 25% this year. Not sure what to say here – they are a small restaurant stock and account for 0.50% of my nestegg.

BJ’s Restaurants -24.94%

My Investment Holdings January 2020

My Investment Holdings January 2020

In annual tradition I will list all of my current investments. These really do not change significantly from year to year as I don’t do a lot of buying and selling and well now as my portfolio has grown so big the amount of money I am putting in towards new investments tends to be sort of insignificant.

Not really too much to add over last years analysis as my portfolio is essentially the same with only 2-3 minor purchases this year.

Ticker% of Porfolio
VPMAX12.29%
VIIIX11.61%
VIEIX10.55%
TSLA10.53%
VILVX10.17%
NFLX7.91%
SHOP6.39%
AMZN6.09%
WOLFRIVER5.79%
AAPL3.13%
CMG3.03%
SBUX2.33%
ANET1.83%
UA1.13%
BIP1.04%
AX0.97%
MIDD0.92%
BRK-B0.91%
AYX0.80%
ISRG0.57%
TXRH0.56%
BJRI0.50%
COST0.30%
TWLO0.28%
BKNG0.17%
ZS0.16%
$$CASH0.03%
Retirement Nestegg Report December 2019

Retirement Nestegg Report December 2019

Well the conclusion to a stellar year for my retirement nestegg. It increased in value by over $317,500 in 2019, which is absolutely mind boggling. Granted it was a great year for the market overall and somewhat of an anomaly, but the fact that I had to do zero work or use any brain power and we got $300,000 richer in a year is sort of bonkers.

The stock market was up over 28% this year and my investments were up even more than the market for the year. My contributions on the other hand were the lowest they’ve been in about 10 years as I’ve decided to let the portfolio do the heavy lifting here (working out ok so far).

If I really want to drop my own jaw I simply only need to go back to the end of the last decade where my December 2009 Financial Report where I was sitting at a grand total of $105,415.89 and was feeling pretty good about finishing a month in 6 figures for the first time. Now 10 years later I increased my nestegg by over 3 times the value of my Dec 2009 report. That’s the magic of compounding.

So what does my Dec 2029 report have in store? Will I increase the value of my portfolio by $3.75M in a year? Who knows and honestly it doesn’t matter as accumilating the most money possible is not the goal of this blog. It’s about accumilating enough money as quickly as possible to give me and my family the freedom to not have to worry about money and for all intents and purposes we are already there so everything from here on out is simply gravy.

Taxable Account- $70,069.58(+13.23%)
Private Stock $72,000 (+0.00%)
Traditional Rollover IRA – $43,987.57(+3.91%)
My Roth IRA – $307,347.80(+8.82%)
Wife Roth IRA – $195,227.71(+7.98%)
Wife 401k – $4,756.71(+2.99%)
Traditional 401k – $554,871.58(+3.15%)

Roth/Traditional % = 40.26% (tax free)

Total Retirement Nest Egg $1,248,260.95(+5.61%)
Retirement Salary (4%) $49,930

Monthly Contributions $1,354.98(401k)
SP500 Performance +2.86%
My Monthly Investment Performance +2.94% (-0.47% vs SP500)
My Monthly Individual Stocks Performance +3.10% (-0.31% vs SP500)

My retirement contributions for 2019 $25,366.43
401k $13,117.48
401k matching $12,248.95
My Roth IRA $0
Wife Roth IRA $0
Taxable Account $0
Wife Retirement Account ??


SP500 Performance for 2019 28.72%
Investment Performance for 2019 +32.46% (+3.74% vs SP500)
Individual Stock Performance for 2019 +37.07% (+8.35% vs SP500)
Total Investment Return 2019 +$292,164.67