Browsed by
Category: General

Retirement Nestegg Report – June 2016

Retirement Nestegg Report – June 2016

Well kind of a mixed month for me. The good news is that my retirement nestegg is at an all-time high, the bad news is that my investments under performed the market quite a bit this month and this year in general and the only reason I hit an all-time new high is that I contributed $26,000 into my taxable account.

The $26,000 was part of $50,000 emergency savings that I had sitting on the sideline to absorb any unforeseen house expenses and be available for other unexpected purchases. Now that we are in our new house and the bulk of the construction costs are now completed I figured it made more sense to get a chunk of that money into the market as $25,000 should be a pretty good safety cushion for an emergency.

Hopefully now that I have contributed over $60,000 YTD and that I will now only be contributing the bare minimum to get 401k match the rest of the year hopefully my investments can get back on track and I can really start charting some new territory with regards to all-time highs.

Taxable Account- $44,606.20 (+134.40%)
Traditional Rollover IRA – $29,583.93 (+0.41%)
My Roth IRA – $139,659.94 (-2.58%)
Wife Roth IRA – $81,165.31 (-2.75%))
Traditional 401k – $266,949.21 (0.00%)

Roth/Traditional % = 39.30% (tax free)

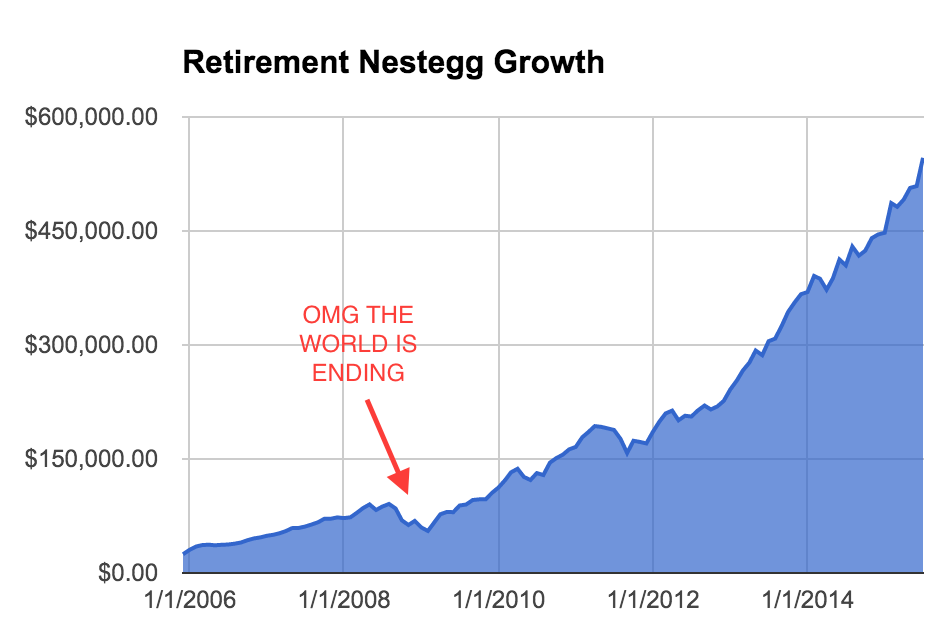
Total Retirement Nest Egg $561,964.58 (+3.61%)
Retirement Salary (4%) – $22,478.58

Monthly Contributions $1,371.16 (401k) $26,000 (Taxable Account)
SP500 Performance +0.09%
My Monthly Investment Performance -1.25% (-1.34% vs SP500)
My Monthly Individual Stocks Performance -1.92% (-2.01% vs SP500)

Retirement Nestegg Report – May 2016

Retirement Nestegg Report – May 2016

Well not a super great month for my investment performance, but did get some overall growth. One item that caught my eye was that in the first 5 months of the year I have contributed nearly $32,000 to my retirement accounts when you add in my employers generous matching program. When I look back at one of the first goals this blog had was to save $100,000 by the time I was 30 and now that I am now just 5 or 6 years later I am saving almost half that amount in a single year.

Certainly you don’t get the same returns when it comes to your salary as you do in the market, but the compounding effect of earning more money and keep expenses low is also quite impressive. It was pretty hard and at times I was saving well over half of my disposable income trying to save enough to him my $100k by 30 goal and now days I have 5 kids, single income, built an extravagant house and I’m averaging over $6k per month in retirement savings. Now granted most of this is front loaded as my 401k matching and bonus and IRA contributions are all done early in the year, but it is still fun to see. Now all I need is a little help from the market to turn this nestegg into a lifetime of financial security for me and my family. In the meantime I will keep throwing logs on the fire.

Taxable Account- $19,030.40 (-6.56%)
Traditional Rollover IRA – $29,462.05 (-0.38%)
My Roth IRA – $143,355.01 (+1.61%)
Wife Roth IRA – $83,462.48 (+8.33%)
Traditional 401k – $267,061.50 (+1.71%)

Roth/Traditional % = 41.82% (tax free)

Total Retirement Nest Egg $542,371.44 (+2.21%)
Retirement Salary (4%) – $21,694.86

Monthly Contributions $1,279.75 (401k) $5500 (Wife Roth IRA)
SP500 Performance +1.53%
My Monthly Investment Performance +0.93% (-0.60% vs SP500)
My Monthly Individual Stocks Performance +0.65% (-0.88% vs SP500)

Retirement Nestegg Report – April 2016

Retirement Nestegg Report – April 2016

Taxable Account- $20,366.02 (+1.02%)
Traditional Rollover IRA – $29,574.73 (-5.11%)
My Roth IRA – $141,085.04 (-2.20%)
Wife Roth IRA – $77,048.21 (-1.31%)
Traditional 401k – $262,576.57 (+1.87%)

Roth/Traditional % = 42.91% (tax free)

Total Retirement Nest Egg $530,650.57 (-0.14%)
Retirement Salary (4%) – $21,226.02

Monthly Contributions $1,405.93 (401k)
SP500 Performance +0.27%
My Monthly Investment Performance -0.41% (-0.68% vs SP500)
My Monthly Individual Stocks Performance -2.04% (-2.31% vs SP500)

Retirement Nestegg Report – March 2016

Retirement Nestegg Report – March 2016

Well a pretty good month for my retirement nestegg. It grew by about $46,000 in one month which is nice. I had the benefit of having over $8k in contributions to my 401k due to receiving a bonus at work this month. This is in addition to the $8k I had last month due to a chunk of my 401k matching hitting as well. Overall it was a wise decision to take my current job 9 years ago due to the very generous bonus and 401k matching programs. I really have not put a ton of effort into my 401k the last 9 years and it has grown to over a quarter of a million dollars!

Not much else to update on this month, but next month should be an exciting as we will hopefully be moved into our dream house – we will have a new giant mortgage and the variability and unknowns for my future financials will be much more stable and I can start concentrating and putting concrete plans on when I will be financially independent and can ditch the normal job.

Taxable Account- $20,160.72 (+15.66%)
Traditional Rollover IRA – $31,167.19 (+1.45%)
My Roth IRA – $144,255.27 (+6.31%)
Wife Roth IRA – $78,074.54 (+5.89%)
Traditional 401k – $257,744.76 (+12.98%)

Roth/Traditional % = 42.91% (tax free)

Total Retirement Nest Egg $531,402.48 (+9.41%)
Retirement Salary (4%) – $21,256.10

Monthly Contributions $8,293.03 (401k)
SP500 Performance +6.60%
My Monthly Investment Performance +9.41% (+2.81% vs SP500)
My Monthly Individual Stocks Performance 6.24% (-0.36% vs SP500)

Retirement Nestegg Report – February 2016

Retirement Nestegg Report – February 2016

Taxable Account- $17,432.54 (-10.30%)
Traditional Rollover IRA – $30,722.07 (+3.38%)
My Roth IRA – $135,692.92 (+1.86%)
Wife Roth IRA – $73,732.62 (+0.35%)
Traditional 401k – $228,140.00 (+1.02%)

Roth/Traditional % = 42.91% (tax free)

Total Retirement Nest Egg $485,720.15 (+0.84%)
Retirement Salary (4%) – $19,428.81

Monthly Contributions $8,089.68 (401k)
SP500 Performance -0.41%
My Monthly Investment Performance -0.84% (-0.43% vs SP500)
My Monthly Individual Stocks Performance -0.49% (-0.08% vs SP500)

Retirement Nestegg Report – January 2016

Retirement Nestegg Report – January 2016

Well a rough month for the market and a rough month for my nestegg and stock performance. I added $3750 to my Roth IRA to take advantage of some of the bargains out there and hopefully next month I can report back more carnage to my nestegg portfolio.

Taxable Account – $19,423.73 (+18.02%)
Traditional Rollover IRA – $29,718.28 (-6.63%)
My Roth IRA – $133,211.06 (-9.21%)
Wife Roth IRA – $73,477.54 (-10.51%)
Traditional 401k – $225,832.92 (-6.42%)

Roth/Traditional % = 42.91% (tax free)

Total Retirement Nest Egg $481,663.53 (-8.37%)
Retirement Salary (4%) – $19,266.54

Monthly Contributions $1716.64 (401k) $3750 Roth IRA
SP500 Performance -5.07%
My Monthly Investment Performance -8.70% (-3.63% vs SP500)
My Monthly Individual Stocks Performance -10.03% (-4.96% vs SP500)

The Long Term View of My NestEgg

The Long Term View of My NestEgg

When I started this blog in 2005 I wasn’t exactly sure why I was doing it. I knew it was for me to learn about myself, but I think one of the big things I remember thinking at the time was it would be a vehicle for me to be able to look back in time and see how the day to day, month to month, and year to year gyrations of the stock market mean nothing in the grand scheme of things and how the people who promote the gyrations and the people who listen to and react to those short term gyrations are foolish.

Well 10+ years of blogging and tracking my accounts have left me with a picture that I think the 26 year old MFJ thought he would see down the road.

NestEggGrowth

It kind of blows my mind looking at that chart – especially the trajectory. That whole compounding thing is pretty powerful. The other thing that kind of blows my mind is that you have to almost squint to see the “Great Recession” where the economy and stock market imploded and if you listened to any of the news media the world was going to come to an end. Even some of the best Personal Finance bloggers out there at the time were losing their minds.

But just look at that picture – if you did anything other than plow your money into the market your entire lifetime you were throwing away boatloads of money.

Now granted I have slightly outperformed the market over the years, but here is a stat for you that I’m sure most people would argue can’t be true.

The SP500 during this tumultuous decade of lost wealth, stagnating economy, and just general doom has been up 12 of the last 13 years.

That’s right since 2003 the SP500 has only been down 1 time. That’s 92%!! The last decade plus has been an absolutely incredible time to invest in the stock market, but again I bet 92% of people you asked would have told you the stock market has lost money almost every year.

Even the last 13 years aren’t even that remarkable. Since I have been alive the SP500 has only been down 6 times. So 30 out of 36 years I’ve been alive – the SP500 has had positive returns.

The odds are definitely in your favor so if you haven’t already – get started, start investing, and create your own amazing chart of wealth awesomeness. All it takes is saving money, investing money, and time – then wait for the amazing things to happen.